
Sometimes during an investigation, you might end up with multiple forensic snapshots to analyze for IOCs. These can often be very large and querying them individually can take a long time as they can often be multiple gigabytes in size. Logging on to multiple machines to run the queries may also be an issue both from the view of ease of access, if they are distributed globally, and from preserving forensic integrity.
Wouldn’t it be great if you could just copy them all to a single location and query everything in one go?
This is where Amazon Athena comes in. Amazon Athena is a serverless, interactive query service that allows you to analyze data in Amazon S3 using standard SQL queries. All you need to do is upload your data, configure a schema and then start running queries.
So how do we do this?
There are a few steps required which we will take you through, these are:
The first two steps we will assume you are already familiar with, if not there is a useful article available here which explains how to generate a snapshot and then convert it into the required JSON format.
Unfortunately, as the snapshot needs to be converted into JSON format in order to run advanced queries on it, you can’t use the auto upload to S3 feature of EDR and the converted snapshot will have to be uploaded a different way. You could do this manually through the AWS web UI, via a script or any other method you choose for uploading data to S3.
All that matters is that all your snapshots end up in the same folder and have a naming convention that allows you to identify which machine it came from. The importance of this will become apparent later.
Once you have all your snapshots converted to JSON and uploaded into your S3 bucket, you should have something that looks a bit like this…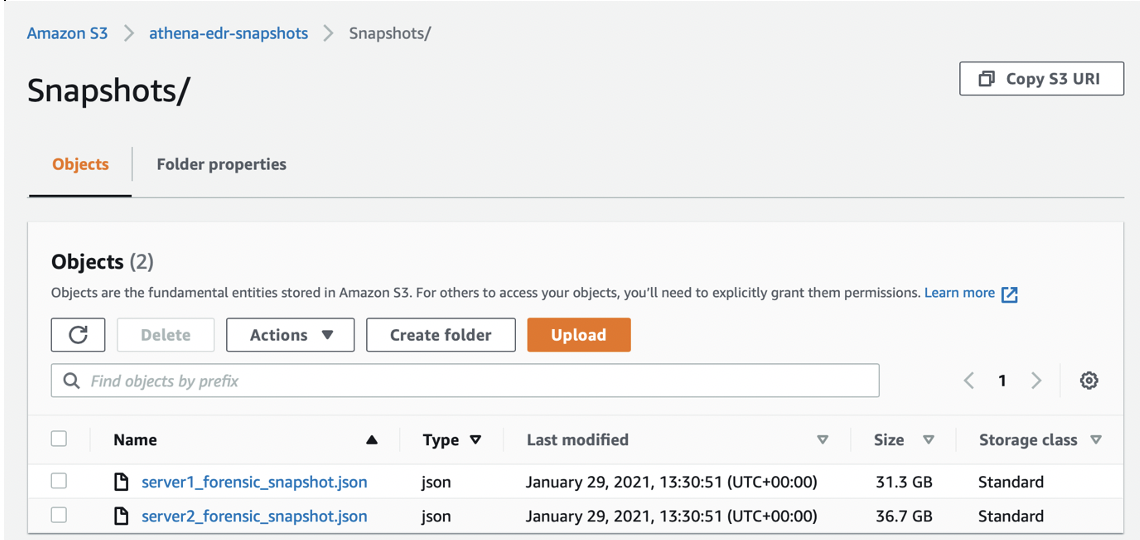
I recommend creating a separate folder to store your snapshots in, as Athena tries to query everything in the location you point it to, you can’t limit it to just one type of file, so to avoid errors or issues, make sure you put all your snapshots into one folder and use this for snapshot data only.
Now we have our data, we need to tell Amazon Athena how to query it by creating a schema.
There is a published schema for a JSON formatted snapshot available here, what we are going to do is re-create this schema in Athena so we can query each available data type using standard SQL commands.
To do this, we need to open the Amazon Athena console and then ensure you are setting up Athena in the same region as the one you created your S3 bucket in, this is important as Athena can’t access buckets across regions.
To get you started we have created a set of SQL queries in this Github repository to help you create an Athena schema that matches the snapshot schema defined in the documentation.
To start with, we create a database using the create_database.sql file from the repo, this contains the simple statement:
CREATE DATABASE interceptx_edr;
You can name this database whatever you like, but just remember that all the queries in the repo will reference this database name, so if you want to change it, you will need to amend all the other queries with the same name.
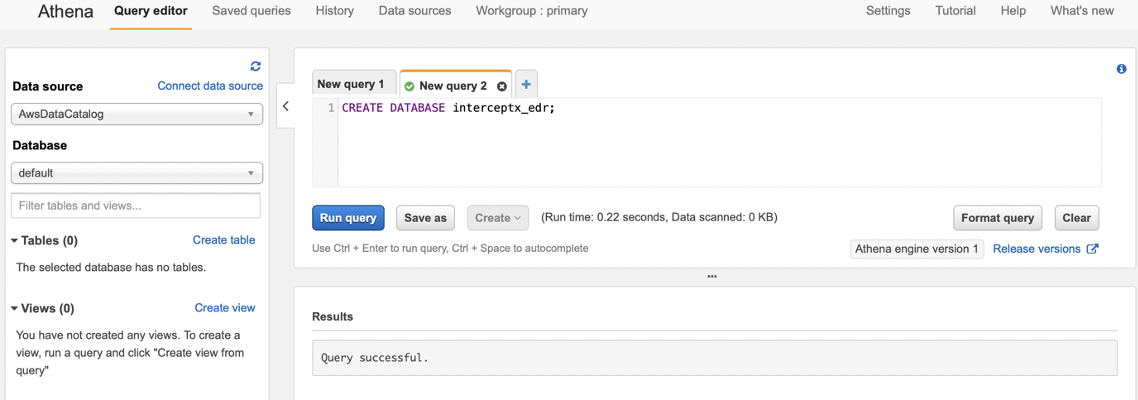
Copy the query into the query editor and run it (don’t worry about the database dropdown on the left for now), you should see at the bottom it say “Query successful”:
*Note, if Athena at any point complains about not having a location set for query results to be saved, simply create a new folder in your bucket called QueryResults and point it there.
Now we have our database, this will be a container for all our tables and views that make us our schema. Firstly we need to create a table.
In Athena, the table defines where the data is stored, what columns should be created and what format Athena should expect the data to be in. We will create one big, wide table will all available columns and then use views to split this up into the different data types available in the snapshot.
Let’s create the table using the create_table.sql file in the repo. You will need to make a change here to ensure that you are pointing to the correct location in S3 where you have saved your snapshots, the part you need to change is right at the bottom.
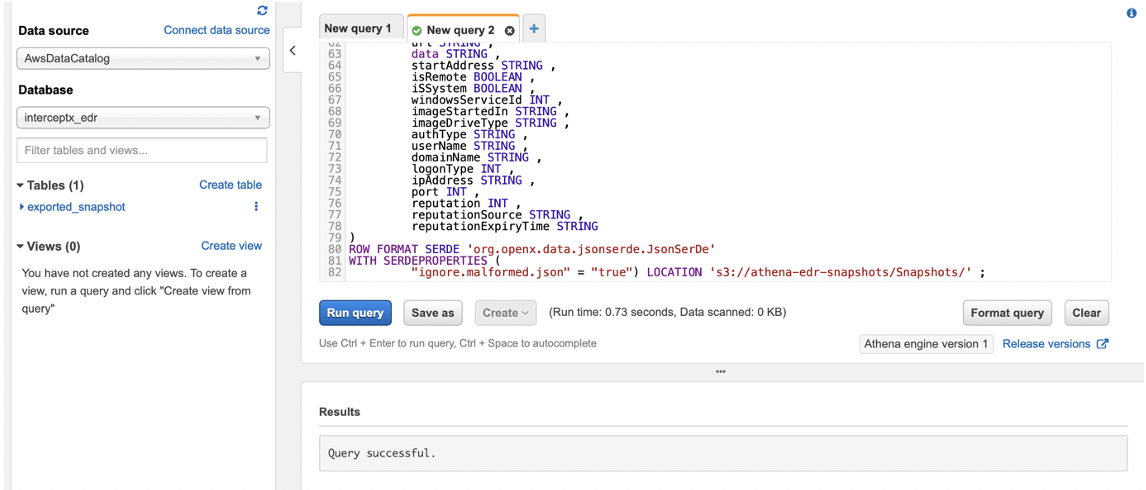
As my snapshots are saved in the bucket “athena-edr-snapshots” in a folder called “Snapshots” I alter the location as shown in the screenshot below (the trailing / is required) and then run it:
If you got the location correct, you should see that it says “Query successful” and an “exported_snapshot” table appears in your database intercept_edr.
At this point your snapshots are now actually queryable using Athena, however to make things a bit easier, we have provided some views which allows you to query each category of data more easily without having to know all of the column names that relate to each data type.
To create these, use the create_views.sql file in the repo and copy out each of the views that you require. You may want all of them, or you may only be interested in a couple of data types such as DNS or Process data for example. Unfortunately Athena doesn’t let you run multiple queries in one window so you will need to create each view individually.
In the below example I will create the Process view and show how to query it.
Firstly copy the create view statement from the create_views.sql file in the Github repo: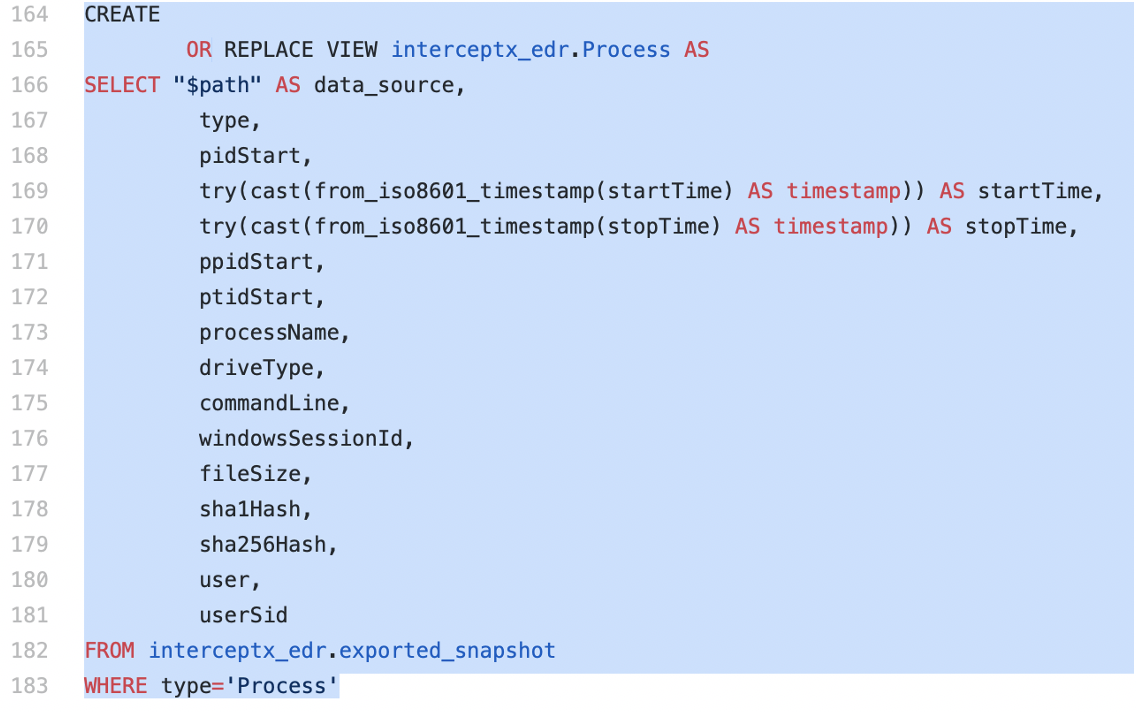
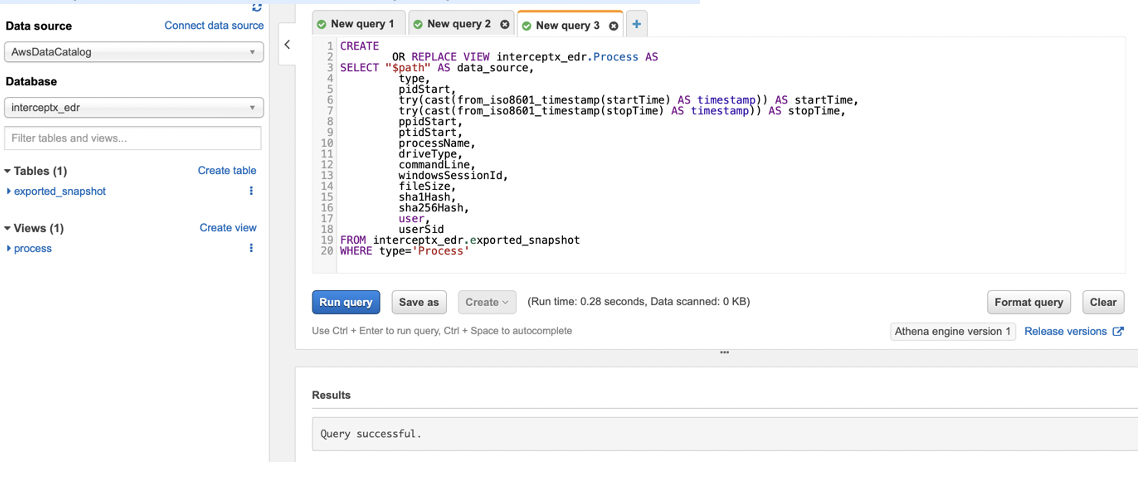
Then paste it into the Athena query editor and run it:
You should see the “Query successful” message and the “process” view appear on the sidebar on the left.
Notice in the view definition the first line of the select statement:
“$path” AS data_source
What this does is take the file path of the snapshot file in S3 and put it into a column called “data_source”. This ensures that when you are querying snapshots from different machines, you can identify which one of them it came from. This is the reason we mentioned having a good naming convention for each of your snapshot files. If you can’t tell which machine they are from by looking at the name, any queries you run are going to be of limited use.
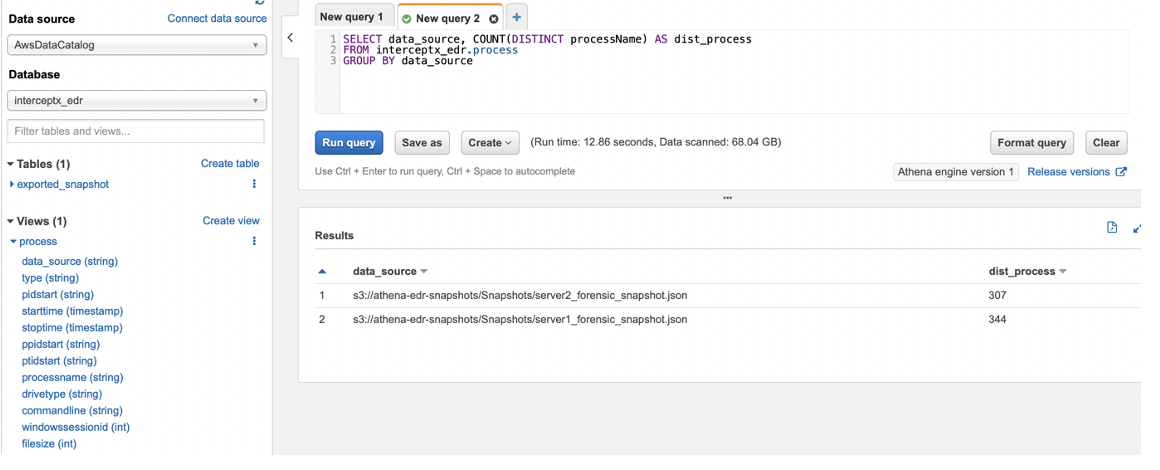
Now let’s run a quick test query and see what we get…
Not the most useful of queries, but as a demonstration it works well, we can see the number of distinct process names in each of our forensic snapshots, using the data_source field, we can identify which server each of these came from and check out the run time and data scanned…
Almost 70Gb of snapshot files scanned in less than 13 seconds. The good thing about this is that each time you re-run the query, it will run across all of the data that is in the bucket each time, so even if you upload 10 more snapshots, you don’t need to change your queries, just re-run them and they will pick up all the latest data.
So, what can I actually use this for?
The test query before was not particularly useful, but there is a lot of threat hunting you can perform with this data, such as:
All the threat hunting you could do with this data is out of the scope of this blog post, but I’m sure you can imagine how useful it is to be able to quickly query all this data from a single location.
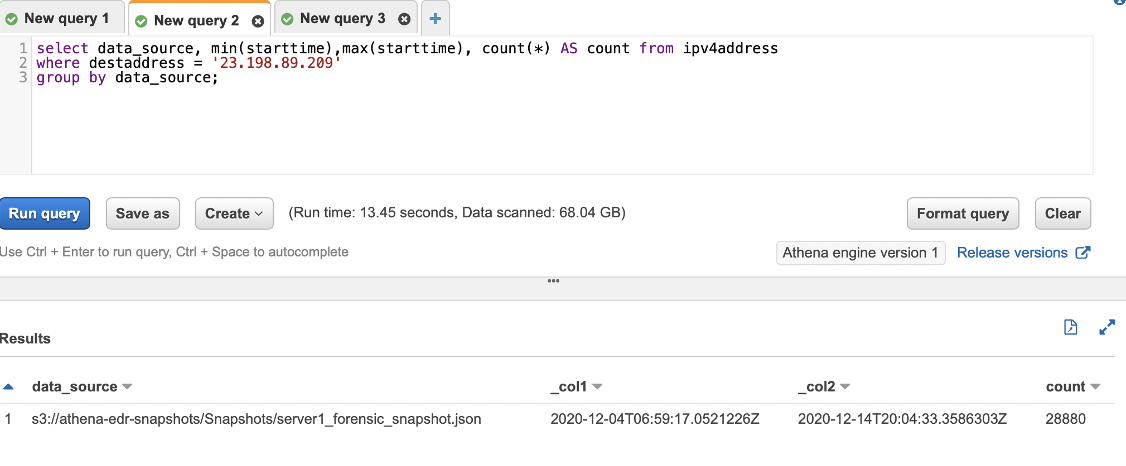
A short example query could be looking for connections to a known IP address, in this example the IP address is benign, but if you had a C2 address and wanted to check if anything had been calling out to it, you could use the following to identify the first time a machine connected to that IP, the last time it was recorded and the count of how many times each machine had connected. The data_source field will show which machine it was that initiated the connection:
This is also a process that’s ripe for automation, converting and uploading snapshots as needed, then running queries over the data periodically looking for known IOCs from threat lists or your own threat data that you have collected.
Visit our website for more information on Sophos EDR and to start a no-obligation 30 day free trial.
If you’re already running Sophos Central you can active a trial directly within your console – no forms required.